
- What: Process safety KPIs are measurable indicators that track the effectiveness of safety barriers, systems, and management practices in preventing major accident hazards covering both leading indicators (proactive measures) and lagging indicators (outcome measures).
- Why: Without defined process safety KPIs, plant managers have no objective way to assess whether their safety management system is effective they are flying blind on the most critical aspect of their operations.
- Problem: Many Malaysian process facilities track occupational safety metrics (LTI, TRIR) but lack specific process safety KPIs, creating a dangerous blind spot where major accident hazard risks go unmeasured and unmanaged.
- Solution: A balanced scorecard of 15 process safety KPIs covering mechanical integrity, process hazard management, safety system performance, and safety culture provides plant managers with actionable intelligence to prevent catastrophic events.
- Next Step: Engage a process safety consultancy to benchmark your current KPI framework against industry best practices and develop a process safety KPI dashboard tailored to your facility.
What Are Process Safety KPIs?
Process safety KPIs are quantitative metrics used to measure, monitor, and improve the performance of safety management systems that prevent major accident hazards fires, explosions, toxic releases, and loss of containment events. They are fundamentally different from occupational safety metrics (such as lost time injury frequency rate or total recordable incident rate), which measure personal safety outcomes like slips, trips, and falls.
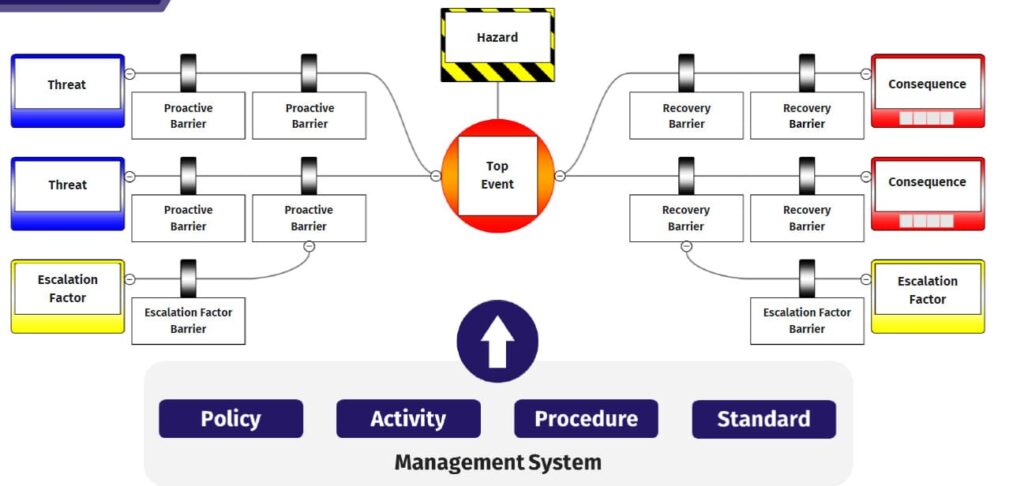
The distinction matters enormously. A facility can have an excellent occupational safety record zero LTIs for years while simultaneously harbouring catastrophic process safety risks. The Deepwater Horizon disaster, the Bhopal tragedy, and numerous refinery explosions worldwide occurred at facilities that appeared safe based on personal safety metrics alone. Process safety KPIs address this blind spot by measuring the health of the barriers that prevent major accidents.
Process safety KPIs are typically categorised into two types:
- Leading Indicators proactive metrics that measure the condition and effectiveness of safety barriers before an incident occurs. Examples include the percentage of overdue safety-critical maintenance, management of change completion rates, and safety system proof test compliance.
- Lagging Indicators reactive metrics that measure safety outcomes after events occur. Examples include Loss of Primary Containment (LOPC) events, process safety incidents, and safety system demand rates.
The most effective process safety KPI frameworks use a balanced combination of both leading and lagging indicators, following guidance from organisations such as the American Petroleum Institute (API RP 754), the Center for Chemical Process Safety (CCPS), and the Energy Institute.
In Malaysia, PETRONAS’ Mandatory Control Framework and process safety management requirements include expectations for process safety performance monitoring. The SSI Regulations 2025 further reinforce this by requiring risk-based data collection and maintenance which implicitly demands KPIs to track the effectiveness of risk management activities.
[AI Image Prompt: An infographic showing the pyramid of process safety indicators Tier 1 (LOPC events) at top, Tier 2 (challenges to safety systems), Tier 3 (near-misses), Tier 4 (leading indicators) at base aligned with API RP 754 framework, professional engineering design]
The 15 Process Safety KPIs Every Plant Manager Should Monitor

Leading Indicators (Proactive)
- Safety-Critical Maintenance Overdue Rate The percentage of safety-critical work orders that are overdue beyond their scheduled completion date. This directly measures the health of your mechanical integrity programme. Industry best practice targets less than 5% overdue rate for safety-critical maintenance.
- Management of Change (MOC) Completion Rate The percentage of MOC requests that have been fully processed, reviewed, and closed including implementation of all safety recommendations within the required timeframe. Open or stalled MOCs represent unmanaged risk.
- HAZOP/PHA Recommendation Closure Rate The percentage of recommendations from HAZOP studies and other process hazard analyses that have been closed within the target timeframe. Overdue recommendations represent identified-but-unmitigated risks.
- Safety Instrumented System (SIS) Proof Test Compliance The percentage of SIS proof tests completed on schedule against the proof test interval assumed in the SIL verification calculations. Missing proof tests directly degrades the reliability of your safety instrumented functions.
- Pressure Relief Device (PRD) Inspection Compliance The percentage of pressure relief devices inspected and tested within the required interval. PRDs are the last line of defence against overpressure events their reliability is non-negotiable.
- Process Safety Training Completion Rate The percentage of personnel in safety-critical roles who have completed required process safety training within the defined cycle. This measures the human element of your safety barriers.
- Safety-Critical Alarm Rate The number of safety-critical alarms per operator per hour during normal operations. High alarm rates contribute to operator fatigue and alarm flooding, degrading the human response to genuine safety threats. Industry best practice targets fewer than 6 alarms per operator per hour.
- Integrity Operating Window (IOW) Exceedance Rate The number and duration of exceedances beyond defined integrity operating windows. IOW exceedances indicate that equipment is operating outside conditions for which its integrity has been assessed, increasing the risk of degradation and failure.
Lagging Indicators (Reactive)
- Loss of Primary Containment (LOPC) Events The number and severity of unplanned releases of hazardous materials from process equipment. LOPC is the foundational lagging indicator for process safety it is what all the barriers are designed to prevent. API RP 754 defines Tier 1 and Tier 2 LOPC events based on release quantity and consequence thresholds.
- Process Safety Incidents (Tier 1) The number of Tier 1 process safety events as defined by API RP 754 events involving an unplanned or uncontrolled release resulting in consequences such as injury requiring hospitalisation, fatality, fire, explosion, or release above threshold quantities.
- Process Safety Events (Tier 2) Tier 2 events are releases that exceed defined threshold quantities but do not meet Tier 1 consequence criteria. Tracking Tier 2 events provides early warning of systemic safety weaknesses before Tier 1 events occur.
- Safety System Demand Rate The number of times safety instrumented functions are demanded to act during actual process upsets. A high demand rate may indicate underlying process control issues, inadequate basic process control system (BPCS) performance, or operating practices that routinely push the process to its safety boundaries.
- Emergency Shutdown (ESD) Activation Rate The number of unplanned emergency shutdowns. While ESD activation demonstrates that safety systems are working, frequent activations indicate underlying process stability issues and increase wear on safety-critical equipment.
Safety Culture Indicators
- Near-Miss Reporting Rate The number of process safety near-misses reported per period. A healthy near-miss reporting culture is a leading indicator of organisational safety maturity. Declining near-miss reports should trigger investigation it may indicate underreporting rather than improved safety.
- Process Safety Audit Finding Closure Rate The percentage of findings from internal and external process safety audits that have been closed within the target timeframe. This measures the organisation’s responsiveness to identified safety gaps and its commitment to continuous improvement.
Malaysian Data & Regulatory Context
In Malaysia, process safety KPI requirements are shaped by PETRONAS’ Mandatory Control Framework, which mandates performance monitoring across all PSM elements. The PETRONAS HSE Management System requires facilities to establish, measure, and report process safety performance indicators.
The SSI Regulations 2025 reinforce the importance of data-driven safety management by requiring plant owners to collect and maintain risk-based data at least every 12 months. While the regulations do not prescribe specific KPIs, the requirement for systematic risk data collection effectively mandates a KPI-driven approach to safety performance monitoring.
Research published in the International Journal of Research and Innovation in Social Science (2025) noted that Malaysia’s oil and gas industry faces challenges in safety management enforcement, with DOSH’s 2021 Annual Report showing that only 24% of over 10,000 inspections led to follow-up actions. Process safety KPIs help bridge this gap by providing plant managers with their own internal measurement system, independent of regulatory inspection frequency.
The Energy Institute’s guidance on process safety performance indicators provides an internationally recognised framework that is widely adopted by Malaysian oil and gas operators. API RP 754 the industry standard for process safety metrics defines the four-tier framework used by most major operators globally, including PETRONAS.
Risk Factors in Process Safety KPI Implementation
Measuring the Wrong Things: The most dangerous mistake is tracking occupational safety metrics (LTI rates) as a proxy for process safety performance. A zero-LTI record provides no assurance about major accident hazard risk.
Data Quality Issues: KPIs are only as good as the data behind them. Inconsistent reporting definitions, incomplete data capture, and manual data entry errors can render KPI dashboards misleading.
Setting Targets Without Context: A target of “zero LOPC events” sounds aspirational but provides no actionable insight. Effective KPI targets should be risk-informed, achievable, and progressive driving continuous improvement rather than encouraging underreporting.
Ignoring Leading Indicators: Facilities that focus exclusively on lagging indicators (incidents that have already occurred) miss the opportunity to intervene proactively. Leading indicators provide the early warning that allows corrective action before incidents happen.
KPI Overload: Tracking too many KPIs dilutes management attention. The 15 KPIs outlined here represent the essential minimum for a comprehensive process safety performance framework facilities should resist the temptation to add more without removing less useful metrics.
Industry Myths vs. Reality
| Myth | Reality |
|---|---|
| “Our LTI rate is zero our safety performance is excellent.” | Zero LTIs measure personal safety, not process safety. Facilities with outstanding personal safety records have experienced catastrophic process safety events. Process safety KPIs measure the barriers that prevent major accidents. |
| “Process safety KPIs are only relevant for oil and gas.” | Any facility operating hazardous processes chemical plants, FMCG manufacturing, power generation, palm oil refining benefits from process safety KPIs. The metrics may differ in scale but the principles apply universally. |
| “We report LOPC events that’s enough for process safety metrics.” | LOPC events are lagging indicators they tell you what already went wrong. Leading indicators tell you what is about to go wrong. A balanced framework needs both. |
| “KPI reporting creates a blame culture.” | When properly implemented, process safety KPIs create a learning culture, not a blame culture. The focus should be on systemic improvements, not individual accountability for incidents. |
| “Our CMMS automatically generates all the KPIs we need.” | CMMS data feeds some MI-related KPIs, but process safety KPIs also require data from HAZOP tracking systems, MOC databases, SIS proof test records, incident reporting systems, and training management systems. Integration is key. |
Our Experience at Pure Integrity
Facing Industry Challenges
In our work with Malaysian process facilities, we consistently find that process safety KPIs are either absent, poorly defined, or not integrated into management decision-making. Many facilities track a handful of lagging indicators typically LOPC events and emergency shutdowns without the leading indicators that provide advance warning of safety barrier degradation.
We have worked with facilities where HAZOP recommendation closure rates were not tracked, where SIS proof test compliance was not measured, and where management of change completion rates were unknown. Without these metrics, plant managers were making safety decisions based on intuition rather than data.
Solving Process Safety KPI Challenges
At Pure Integrity, we help facilities design, implement, and sustain process safety KPI frameworks that drive genuine safety improvement. Our approach integrates KPI design with the broader process safety management framework to ensure that metrics are actionable, not just reportable.
Our Procedure for Process Safety KPI Implementation
Step 1: Current State Assessment We evaluate your existing safety performance measurement framework against API RP 754, Energy Institute guidance, and PETRONAS requirements.
Step 2: KPI Selection & Definition We work with your management team to select the most relevant KPIs for your facility, define clear measurement methodologies, and establish baseline values.
Step 3: Data Source Mapping We identify the data sources for each KPI CMMS, HAZOP tracking, SIS management, incident reporting, training records and establish data collection processes.
Step 4: Dashboard Design We design a process safety KPI dashboard that presents information in a clear, actionable format for different management levels.
Step 5: Target Setting We help establish risk-informed, progressive targets that drive continuous improvement without encouraging underreporting.
Step 6: Review Cycle Establishment We establish regular KPI review cycles monthly for operational KPIs, quarterly for management review with defined escalation procedures for adverse trends.
Expert Commentary

Process safety KPIs are the instrument panel for your safety management system. Just as a pilot would never fly without functioning instruments, a plant manager should never operate without functioning process safety metrics.
Experts suggested that Malaysian plant managers adopt the API RP 754 framework as the foundation for their process safety KPI programme. This provides a globally recognised, structured approach that aligns with PETRONAS reporting requirements and facilitates benchmarking against industry peers.
The most important insight is this: the value of process safety KPIs is not in the numbers themselves, but in the conversations they trigger. When a KPI shows that SIS proof test compliance has dropped from 98% to 85%, the important question is not “what is the number?” but “why has it dropped, and what are we going to do about it?” Energy Institute suggested that KPI reviews focus on trends and actions rather than absolute values.
For facilities that are just beginning their process safety KPI journey, start with the five most critical metrics: LOPC events, safety-critical maintenance overdue rate, MOC completion rate, HAZOP recommendation closure rate, and SIS proof test compliance. These five KPIs alone will provide more insight into your process safety performance than a thousand LTI statistics.
When Should You Seek Professional Consultancy?
KPI Framework Development: When establishing a process safety KPI programme from scratch, professional guidance ensures the framework is aligned with industry standards and regulatory requirements.
Benchmarking: When you want to compare your process safety performance against industry peers or best practices.
KPI Audit: When existing KPIs are not driving safety improvement or when data quality concerns undermine confidence in reported metrics.
Regulatory Preparation: When preparing for PETRONAS compliance reviews or DOSH audits that assess safety performance monitoring.
Post-Incident Review: When incident investigation reveals that existing KPIs failed to provide adequate early warning.
Safety Culture Assessment: When process safety KPIs are combined with safety culture surveys to provide a comprehensive picture of organisational safety health.
What is the difference between process safety KPIs and occupational safety KPIs?
Occupational safety KPIs measure personal safety outcomes slips, trips, falls, ergonomic injuries. Process safety KPIs measure the health of barriers preventing major accident hazards fires, explosions, toxic releases. A facility can have excellent occupational safety metrics while harbouring significant process safety risks.
Which process safety KPIs are most important for Malaysian oil and gas facilities?
The five essential KPIs are: Loss of Primary Containment (LOPC) events, safety-critical maintenance overdue rate, SIS proof test compliance, HAZOP recommendation closure rate, and Management of Change (MOC) completion rate. These cover both leading and lagging dimensions and align with PETRONAS reporting requirements.
How should process safety KPIs be reported?
Process safety KPIs should be reviewed monthly at operational level and quarterly at management level, with defined escalation procedures for adverse trends. Dashboard presentations that show trends over time are more valuable than single-point snapshots. API RP 754 provides the standard reporting framework used by most major operators.
What is API RP 754 and how does it relate to process safety KPIs?
API RP 754 is the American Petroleum Institute’s recommended practice for Process Safety Performance Indicators. It defines a four-tier framework of indicators from Tier 1 (major LOPC events) through Tier 4 (leading indicators) providing a standardised approach to process safety measurement that is widely adopted in the global oil and gas industry.
Can process safety KPIs predict incidents?
Leading indicator KPIs do not predict specific incidents, but they identify conditions under which incidents become more likely. Deteriorating trends in leading indicators such as increasing maintenance backlogs, declining proof test compliance, or growing MOC completion delays signal weakening safety barriers that require management intervention.
Conclusion
Process safety KPIs transform safety management from hope to measurement. They provide plant managers with the objective data needed to identify weakening barriers, allocate resources effectively, and demonstrate to regulators, stakeholders, and communities that safety is managed with the same rigour as production and financial performance.
In Malaysia’s industrial landscape where aging infrastructure, evolving regulations, and increasing public scrutiny demand ever-higher standards of safety management a robust process safety KPI framework is not a luxury. It is the minimum standard of professional plant management.
At Pure Integrity, we help facilities design and implement process safety KPI frameworks that drive real safety improvement. Reach out to our team because what gets measured gets managed, and what gets managed gets safer.
References
- API, “API RP 754 Process Safety Performance Indicators for the Refining and Petrochemical Industries.” Akses: https://www.api.org/products-and-services/individual-certification-programs/certifications/api580
- OSHA, “Process Safety Management of Highly Hazardous Chemicals (OSHA 3132).” Akses: https://www.osha.gov/sites/default/files/publications/OSHA3132.pdf
- PETRONAS, “PETRONAS and DOSH Mark Regulatory Milestone with Launch of SSI Regulations 2025,” 12-August-2025. Akses: https://www.petronas.com/media/media-releases/petronas-and-dosh-mark-regulatory-milestone-launch-ssi-regulations-2025
- International Journal of Research and Innovation in Social Science, “Enhancing Safety Management Practices in the Malaysian Oil and Gas Industry,” 2025. Akses: https://rsisinternational.org/journals/ijriss/articles/enhancing-safety-management-practices-in-the-malaysian-oil-and-gas-industry-challenges-strategies-and-future-directions/
- Journal of Engineering Research and Reports, “A Case Study of Asset Integrity and Process Safety Management of Major Oil and Gas Companies in Malaysia,” 2021. Akses: https://doi.org/10.9734/jerr/2021/v20i217260
- ILO, “Malaysia advances worker safety and health through ILO standards,” April 2026. Akses: https://www.ilo.org/resource/news/malaysia-advances-worker-safety-and-health-through-ilo-standards
- DOSH Malaysia, “Guidelines on Occupational Safety and Health Management Systems.” Akses: https://dosh.gov.my/wp-content/uploads/2024/10/Garis-Panduan-bagi-Sistem-Pengurusan-Keselamatan-dan-Kesihatan-Pekerjaan-OSHMS.pdf
This article had been reviewed by
Dr. Khairil Osman – A TUV Certified Functional Safety Engineer who graduated from the University of Southampton and works as Operation Director at Pure Integrity.